Matplotlib, NumPy, SciPy 2020
Let's start from scratch with Python 2.7.
- Install python from http://python.org/download/
- Run distribute_setup.py script. Then, we'll have easy_install under Scripts directory.
- Install NeworkX package for build/analyzing graphs
C:\Python27\Scripts>easy_install networkxWe can check if it's really installed:C:\Python27\Scripts>python >>> import networkx >>>
- Install NumPy
C:\Python27\Scripts>easy_install numpyWe can test your progress:>>> import numpy >>> print numpy.__version__Matplotlib requires numpy version 1.1 or later - Install ipython
C:\Python27\Scripts>easy_install ipython - Install Matplotlib
- Go to http://sourceforge.net/projects/matplotlib/files/
- Click "Download matplotlib-1.1.0.win32-py2.7.exe (4.2 MB)"
In my case, since the ease_install for Matplotlib did not work, I directly executed matplotlib-1.1.0.win32-py2.7.exe.
- Install SciPy
- Go to sourceforge.net
Again, since the ease_install for SciPy did not work, scipy-0.9.0rc5-win32-superpack-python2.7.exe will be automatically run and install SciPy.
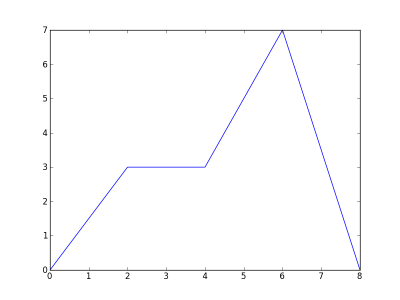
Let's import matplotlib's function-based interface:
import matplotlib.pyplot as pyp
x = [0, 2, 4, 6, 8]
y = [0, 3, 3, 7, 0]
pyp.plot(x, y)
pyp.savefig("MyFirstPlot.png")
The pyplot interface is a function-based interface that uses the Matlab-like conventions. However, it does not include the NumPy functions. So, if we want to use NumPy, it must be imported separately.
Actually, there is a good tutorial for beginners.
http://www.ast.uct.ac.za/~sarblyth/pythonGuide/PythonPlottingBeginnersGuide.pdf
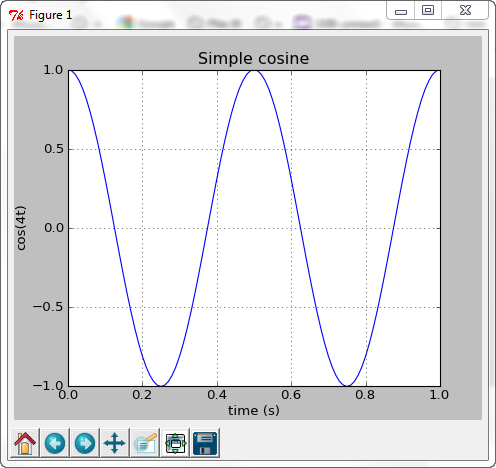
Here is another simple Matplotlib code.
import numpy
import pylab

t = numpy.arange(0.0, 1.0+0.01, 0.01)
s = numpy.cos(numpy.pi*4*t)
pylab.plot(t, s)

pylab.xlabel('time (s)')
pylab.ylabel('cos(4t)')
pylab.title('Simple cosine')
pylab.grid(True)
pylab.savefig('simple_cosine')

pylab.show()
The last line of code, pylab.show() pops up 2D plot:
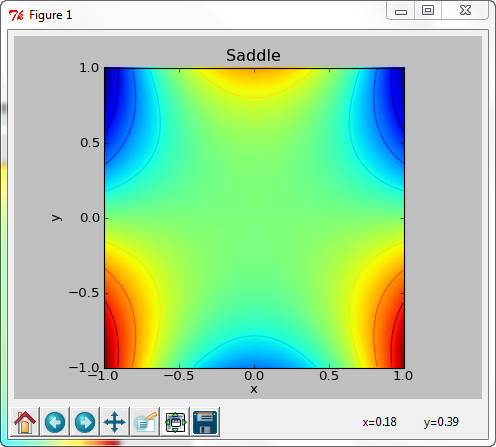
import scipy
import pylab
import matplotlib.pyplot as plt

x,y = scipy.ogrid[-1.:1.:.01, -1.:1.:.01]
z = x**3-3*x*y**2
pylab.imshow(z, origin='lower', extent=[-1,1,-1,1])
plt.contour(z, origin='lower', extent=[-1,1,-1,1])
pylab.xlabel('x')
pylab.ylabel('y')
pylab.title('Saddle')
pylab.savefig('Saddle')
plt.show()
The following example show the case when x-axis is date string.
import numpy as np
import matplotlib.pyplot as plt
import datetime as DT

data= np.loadtxt('daily_count.csv', delimiter=',',
         dtype={'names': ('date', 'count'),'formats': ('S10', 'i4')} )

x = [DT.datetime.strptime(key,"%Y-%m-%d") for (key, value) in data ]
y = [value for (key, value) in data]

fig = plt.figure()
ax = fig.add_subplot(111)
ax.grid()

fig.autofmt_xdate()

plt.plot(x,y,'b--o--')
plt.xlabel('Date')
plt.ylabel('Daily Count')
plt.title('Daily Count since February')
plt.show()
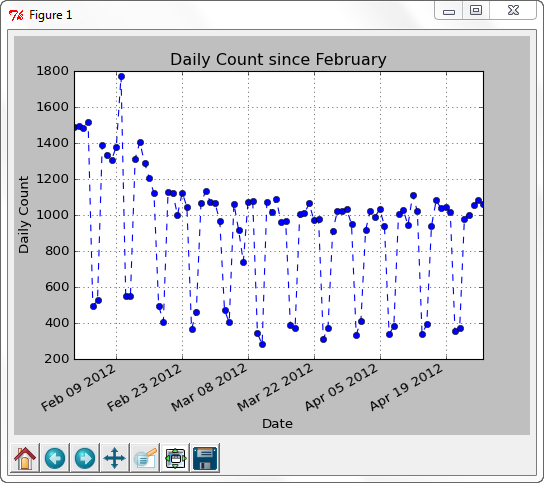
The input data is daily_count.csv
The following example show the case when we have several columns of data.
import numpy as np
import matplotlib.pyplot as plt
import datetime as dt
import matplotlib.dates as md

data= np.loadtxt('vmstat_7days_without_header.csv', delimiter=',',
    dtype={'names': ['time', 'mon','tue','wed','thrs','fri','sat','sun'],
           'formats': ['S8','i4','i4','i4','i4','i4','i4','i4']} )

x,y1,y2,y3,y4,y5,y6,y7 = [],[],[],[],[],[],[],[]

for z in data:
# 10 minute span
	if int((z[0].split(':',2))[1]) % 10 == 0:
		xc = dt.datetime.strptime(z[0],"%H:%M:%S")
		x.append(xc)
		y1.append(z[1])
		y2.append(z[2])
		y3.append(z[3])
		y4.append(z[4])
		y5.append(z[5])
		y6.append(z[6])
		y7.append(z[7])

fig = plt.figure()
ax = fig.add_subplot(111)
xfmt = md.DateFormatter('%H')
ax.xaxis.set_major_formatter(xfmt)
ax.grid()

# slanted x-axis tick label
fig.autofmt_xdate()

p1 = plt.plot(x,y1,'rs')
p2 = plt.plot(x,y2,'gp')
p3 = plt.plot(x,y3,'b*')
p4 = plt.plot(x,y4,'ch')
p5 = plt.plot(x,y5,'mp')
p6 = plt.plot(x,y6,'ys')
p7 = plt.plot(x,y7,'kD')

plt.ylabel("CPU Idle [%]")
plt.xlabel("Time of the day[hr]")

plt.ylim(84.0, 101)

plt.title("CPU Load for 7 days (10min interval), Idling Time, from vmstat command")

#let python select the best position for legend
plt.legend([p1[0],p2[0],p3[0],p4[0],p5[0],p6[0],p7[0]],
          ['Mon','Tue','Wed','Thu','Fri','Sat','Sun'], 'best', numpoints=1)

plt.show()
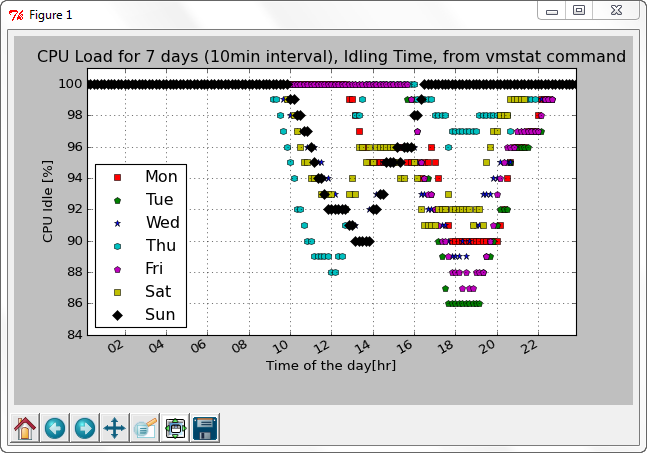
The input data used for the above example is vmstat_7days_without_header.csv
Unlike the other examples above, fore this one, I used Python 3.3 just because of my new computer is AMD64. So, I needed new packages:
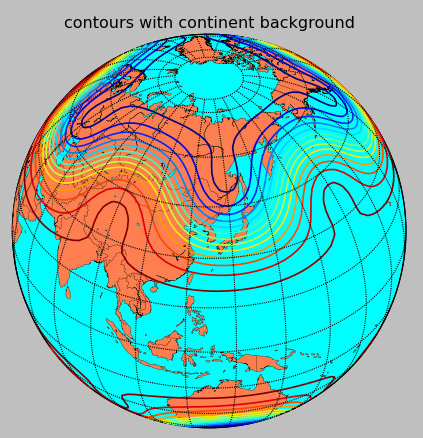
The code used is virtually the same one as in the Plotting data on a map.
from mpl_toolkits.basemap import Basemap
import matplotlib.pyplot as plt
import numpy as np
# set up orthographic map projection with
# perspective of satellite looking down at 38N, 127E.
# use low resolution coastlines.
map = Basemap(projection='ortho',lat_0=38,lon_0=127,resolution='l')
# draw coastlines, country boundaries, fill continents.
map.drawcoastlines(linewidth=0.25)
map.drawcountries(linewidth=0.25)
map.fillcontinents(color='coral',lake_color='aqua')
# draw the edge of the map projection region (the projection limb)
map.drawmapboundary(fill_color='aqua')
# draw lat/lon grid lines every 15 degrees.
map.drawmeridians(np.arange(0,360,15))
map.drawparallels(np.arange(-90,90,15))
# make up some data on a regular lat/lon grid.
nlats = 73; nlons = 145; delta = 2.*np.pi/(nlons-1)
lats = (0.5*np.pi-delta*np.indices((nlats,nlons))[0,:,:])
lons = (delta*np.indices((nlats,nlons))[1,:,:])
wave = 0.75*(np.sin(2.*lats)**8*np.cos(4.*lons))
mean = 0.5*np.cos(2.*lats)*((np.sin(2.*lats))**2 + 2.)
# compute native map projection coordinates of lat/lon grid.
x, y = map(lons*180./np.pi, lats*180./np.pi)
# contour data over the map.
cs = map.contour(x,y,wave+mean,15,linewidths=1.5)
plt.title('contours with continent background')
plt.show()
This was done as a preliminary step for my small project, "Uniform distribution of points on the surface of a sphere".
I removed axis, and the color display will be used to indicate the density of the points and it's not implemented yet. The calculation was done in C++, and this example was used to just for checking purpose. The points were calculated algebraically, 50(θ) x 50(φ).
from mpl_toolkits.mplot3d import Axes3D
import matplotlib.pyplot as plt
import numpy as np
from matplotlib import cm

fig = plt.figure()
ax = fig.add_subplot(111, projection='3d')
ax.set_aspect("equal")
ax.view_init(elev=0, azim=90)

u = np.linspace(0, 2 * np.pi, 100)
v = np.linspace(0, np.pi, 100)

x = np.outer(np.cos(u), np.sin(v))
y = np.outer(np.sin(u), np.sin(v))
z = np.outer(np.ones(np.size(u)), np.cos(v))

ax.plot_surface(x, y, z,  rstride=2, cstride=2, color='b', alpha = 0.3, linewidth = 0, cmap=cm.jet)

data = np.loadtxt(r'C:\matplotlib_test\sample.csv', delimiter=',',dtype=None)
xx, yy, zz = [], [], []
for d in data:
	xx.append(d[0])
	yy.append(d[1])
	zz.append(d[2])

ax.scatter(xx, yy, zz, color="k", s=1)

plt.axis('off')
plt.show()
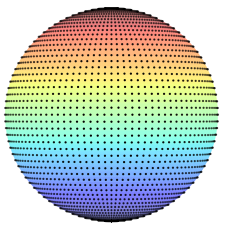
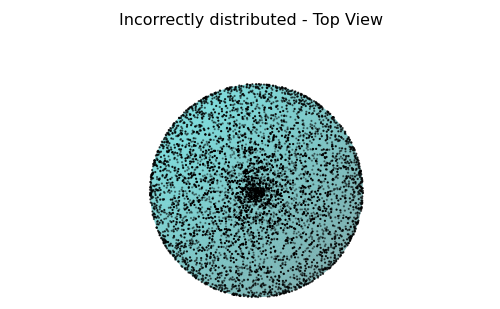
We see that the points are certainly not distributed evenly. They are much more dense at the poles. This is because the mapping from spherical to Cartesian coordinates does not preserve area. That is, the spherical space is pinched and compressed at the poles by the mapping.
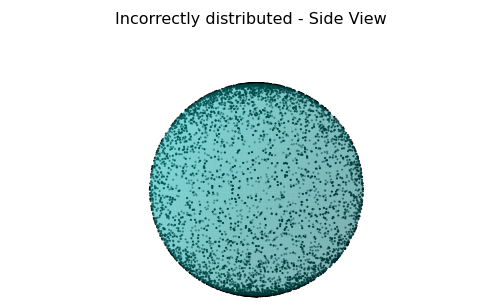
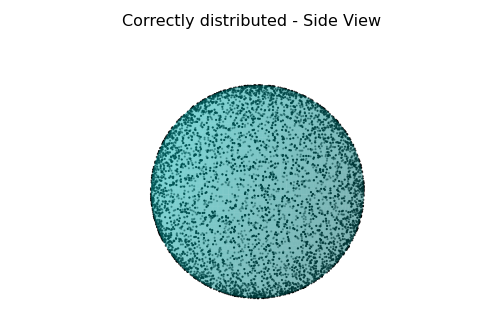
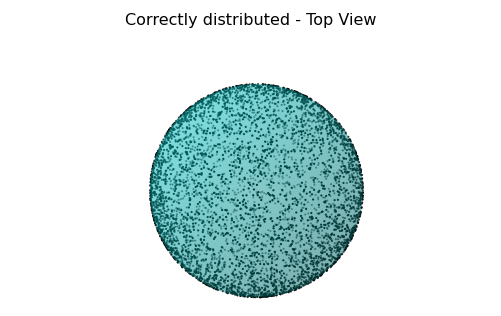
The followings sampling used random numbers. The incorrect ones used normal random numbers while the correct (at least better) ones reflected the dependency of $\phi$.
$$P(\phi) = \frac{\sin \phi}{2}$$In other words, by using CDF (Cumulative Distribution Function),
we get the correct random variable for $\phi = \cos^{-1}(2v-1).$
Sampling points = 5,000 and Matplotlib were used for the plots.
For C++ code, please visit Algorithms: Distributing Points.
from mpl_toolkits.mplot3d import Axes3D
import matplotlib.pyplot as plt
import numpy as np
from matplotlib import cm

fig = plt.figure()
ax = fig.add_subplot(111, projection='3d')
ax.set_aspect("equal")

# top: elev=90, side: elev=0
ax.view_init(elev=0, azim=0)

u = np.linspace(0, 2 * np.pi, 120)
v = np.linspace(0, np.pi, 60)

x = np.outer(np.cos(u), np.sin(v))
y = np.outer(np.sin(u), np.sin(v))
z = np.outer(np.ones(np.size(u)), np.cos(v))

#ax.plot_surface(x, y, z,  rstride=2, cstride=2, color='b', #alpha = 0.3, linewidth = 0, cmap=cm.jet)
ax.plot_surface(x, y, z,  rstride=1, cstride=1, color='c', alpha = 0.3, linewidth = 0)

data = np.loadtxt(r'C:\TEST2\CDF\first.csv', delimiter=',',dtype=None)

xx, yy, zz = [], [], []
for d in data:
	xx.append(d[0])
	yy.append(d[1])
	zz.append(d[2])

ax.scatter(xx,yy,zz,color="k",s=1)

plt.title('Correctly distributed - Side View')
plt.axis('off')
plt.show()
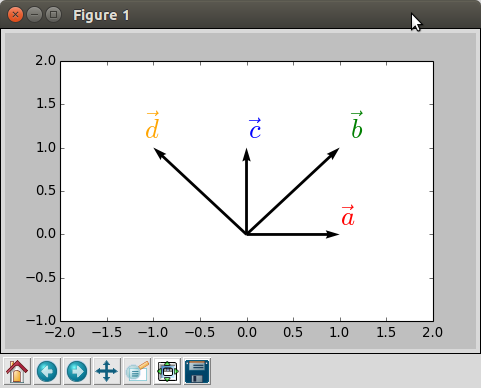
Here is a sample code of vectors:
import numpy as np
import matplotlib.pyplot as plt
soa =np.array( [ [0,0,1,0], [0,0,1,1],[0,0,0,1], [0,0,-1,1]])
X,Y,U,V = zip(*soa)
plt.figure()
ax = plt.gca()
ax.quiver(X,Y,U,V,angles='xy',scale_units='xy',scale=1)
ax.set_xlim([-2,2])
ax.set_ylim([-1,2])
plt.text(1.0, 0.1, r'$\vec a$', fontsize=24, color='red', fontweight='bold')
plt.text(1.1, 1.1, r'$\vec b$', fontsize=24, color='green', fontweight='bold')
plt.text(0.0, 1.1, r'$\vec c$', fontsize=24, color='blue', fontweight='bold')
plt.text(-1.1, 1.1, r'$\vec d$', fontsize=24, color='orange', fontweight='bold')
plt.draw()
plt.show()
Output:
 Data Analysis with Open Source Tools by Philipp K. Janert (Nov 25, 2010)
Datasets and codes are available at http://examples.oreilly.com/9780596802363/
 Programming Collective Intelligence by Toby Segaran.

Programming Computer Vision with Python - March 2012 (pdf) or get it from http://programmingcomputervision.com/
Python tutorial
Python Home
Introduction
Running Python Programs (os, sys, import)
Modules and IDLE (Import, Reload, exec)
Object Types - Numbers, Strings, and None
Strings - Escape Sequence, Raw String, and Slicing
Strings - Methods
Formatting Strings - expressions and method calls
Files and os.path
Traversing directories recursively
Subprocess Module
Regular Expressions with Python
Regular Expressions Cheat Sheet
Object Types - Lists
Object Types - Dictionaries and Tuples
Functions def, *args, **kargs
Functions lambda
Built-in Functions
map, filter, and reduce
Decorators
List Comprehension
Sets (union/intersection) and itertools - Jaccard coefficient and shingling to check plagiarism
Hashing (Hash tables and hashlib)
Dictionary Comprehension with zip
The yield keyword
Generator Functions and Expressions
generator.send() method
Iterators
Classes and Instances (__init__, __call__, etc.)
if__name__ == '__main__'
argparse
Exceptions
@static method vs class method
Private attributes and private methods
bits, bytes, bitstring, and constBitStream
json.dump(s) and json.load(s)
Python Object Serialization - pickle and json
Python Object Serialization - yaml and json
Priority queue and heap queue data structure
Graph data structure
Dijkstra's shortest path algorithm
Prim's spanning tree algorithm
Closure
Functional programming in Python
Remote running a local file using ssh
SQLite 3 - A. Connecting to DB, create/drop table, and insert data into a table
SQLite 3 - B. Selecting, updating and deleting data
MongoDB with PyMongo I - Installing MongoDB ...
Python HTTP Web Services - urllib, httplib2
Web scraping with Selenium for checking domain availability
REST API : Http Requests for Humans with Flask
Blog app with Tornado
Multithreading ...
Python Network Programming I - Basic Server / Client : A Basics
Python Network Programming I - Basic Server / Client : B File Transfer
Python Network Programming II - Chat Server / Client
Python Network Programming III - Echo Server using socketserver network framework
Python Network Programming IV - Asynchronous Request Handling : ThreadingMixIn and ForkingMixIn
Python Coding Questions I
Python Coding Questions II
Python Coding Questions III
Python Coding Questions IV
Python Coding Questions V
Python Coding Questions VI
Python Coding Questions VII
Python Coding Questions VIII
Python Coding Questions IX
Python Coding Questions X
Image processing with Python image library Pillow
Python and C++ with SIP
PyDev with Eclipse
Matplotlib
Redis with Python
NumPy array basics A
NumPy Matrix and Linear Algebra
Pandas with NumPy and Matplotlib
Celluar Automata
Batch gradient descent algorithm
Longest Common Substring Algorithm
Python Unit Test - TDD using unittest.TestCase class
Simple tool - Google page ranking by keywords
Google App Hello World
Google App webapp2 and WSGI
Uploading Google App Hello World
Python 2 vs Python 3
virtualenv and virtualenvwrapper
Uploading a big file to AWS S3 using boto module
Scheduled stopping and starting an AWS instance
Cloudera CDH5 - Scheduled stopping and starting services
Removing Cloud Files - Rackspace API with curl and subprocess
Checking if a process is running/hanging and stop/run a scheduled task on Windows
Apache Spark 1.3 with PySpark (Spark Python API) Shell
Apache Spark 1.2 Streaming
bottle 0.12.7 - Fast and simple WSGI-micro framework for small web-applications ...
Flask app with Apache WSGI on Ubuntu14/CentOS7 ...
Fabric - streamlining the use of SSH for application deployment
Ansible Quick Preview - Setting up web servers with Nginx, configure enviroments, and deploy an App
Neural Networks with backpropagation for XOR using one hidden layer
NLP - NLTK (Natural Language Toolkit) ...
RabbitMQ(Message broker server) and Celery(Task queue) ...
OpenCV3 and Matplotlib ...
Simple tool - Concatenating slides using FFmpeg ...
iPython - Signal Processing with NumPy
iPython and Jupyter - Install Jupyter, iPython Notebook, drawing with Matplotlib, and publishing it to Github
iPython and Jupyter Notebook with Embedded D3.js
Downloading YouTube videos using youtube-dl embedded with Python
Machine Learning : scikit-learn ...
Django 1.6/1.8 Web Framework ...
Ph.D. / Golden Gate Ave, San Francisco / Seoul National Univ / Carnegie Mellon / UC Berkeley / DevOps / Deep Learning / Visualization