DevOps / Sys Admin Q & A #3 : Linux Systems
- Process scheduling - linux is a preemptive multitasking operating system. Preemptive means that the rules governing which processes receive use of the CPU and for how long are determined by the kernel process scheduler.
- Creation and termination of processes.
- Memory management - linux employs virtual memory management which has two main advantages. Processes are isolated from one another and from the kernel, so that one process can't read or modify the memory of another process or the kernel.
- The kernel provides a file system.
- Access to devices such as mice, monitors, keyboards, disk and tape drives, and so on).
- Provision of a system call application programming interface (API).
- Networking
Runlevel is a mode of operation in OS, and a runlevel represents the different system state of a Linux system.
When the Linux system boots, the kernel is initialized, and then enters one (and only one) runlevel. When a service starts, it will try to start all the services that are associated with that runlevel.
In general, when a computer enters runlevel 0, the system shuts down all running processes, unmounts all file systems, and powers off.
When it enters runlevel 6, it reboots.
The intermediate runlevels (1-5) differ in terms of which drives are mounted, and which network services are started. Default runlevels are typically 3, 4, or 5.
Runlevel 1 is reserved for single-user mode-a state where only a single user can log in to the system.
'Single user' mode runlevel 1 (or 'S') is sometimes called a 'rescue', or a 'trouble-shooting' mode.
Generally, few processes are started in single-user mode, so it is a very useful runlevel for diagnostics when a system won't fully boot. Even in the default GRUB menu we will notice a recovery mode option that boots us into runlevel 1.
In other words, runlevels define what tasks can be accomplished in the current state (or runlevel) of a Linux system. Every Linux system supports three basic runlevels, plus one or more runlevels for a normal operation.
Lower run levels are useful for maintenance or emergency repairs, since they usually don't offer any network services at all.
We can check current runlevel simply by issuing runlevel command:
$ runlevel
N 2
It shows both the previous runlevel and the current one. If the first output character is 'N', the runlevel has not been changed since the system was booted.
We can set the runlevel without reboot using telinit:
$ sudo telinit 5

$ runlevel
2 5
If we use telinit 3 from runlevel=5, we'll immediately lose GUI and get a shell login prompt!

For systemd, the concept of runlevels is replaced by the term "targets":

To check default runlevel on CentOS 7 / RHEL 7 and switch it to other target:
$ systemctl get-default
graphical.target

$ sudo systemctl set-default multi-user.target
Removed /etc/systemd/system/default.target.
Created symlink /etc/systemd/system/default.target, pointing to /usr/lib/systemd/system/multi-user.target.

$ systemctl get-default
multi-user.target
Under the folder /etc/init.d/, we find all the init scripts for different boot up services, like apache2, networking, etc.
Depending on which runlevel the computer starts in, different services are started. For example, let's look int /etc/init.d/nginx, we can see the when the nginx server runs (runlevel 2 3 4 5):
### BEGIN INIT INFO
# Provides:       nginx
# Required-Start:    $local_fs $remote_fs $network $syslog $named
# Required-Stop:     $local_fs $remote_fs $network $syslog $named
# Default-Start:     2 3 4 5
# Default-Stop:      0 1 6
# Short-Description: starts the nginx web server
# Description:       starts nginx using start-stop-daemon
### END INIT INFO
The run levels are defined by files in the file system. All the run level files are found in the /etc directory according to the following table:
/etc/rc0.d              Run level 0
/etc/rc1.d              Run level 1
/etc/rc2.d              Run level 2
/etc/rc3.d              Run level 3
/etc/rc4.d              Run level 4
/etc/rc5.d              Run level 5
/etc/rc6.d              Run level 6
Let's look into some of the directories rc2.d and rc6.d in Ubuntu 14:
rc2.d:
$ ls /etc/rc2.d
K08vmware-USBArbitrator  S20nagios-nrpe-server  S50saned
K09apache2               S20puppetmaster        S50vmware-USBArbitrator
K80nginx                 S20puppetqd            S55vmware-workstation-server
README                   S20rabbitmq-server     S70dns-clean
S19postgresql            S20redis_6379          S70pppd-dns
S19vmware                S20redis-server        S92tomcat7
S20apache-htcacheclean   S20rsync               S95elasticsearch
S20fcgiwrap              S20speech-dispatcher   S95kibana
S20jenkins               S20sysstat             S99chef-client
S20jetty8                S20virtualbox          S99grub-common
S20kerneloops            S23ntp                 S99monit
S20memcached             S25vmamqpd             S99ondemand
S20nagios                S50cassandra           S99rc.local
rc6.d:
K01monit                      K20jenkins             K20rsync
K02chef-client                K20jetty8              K20speech-dispatcher
K06vmamqpd                    K20kerneloops          K20virtualbox
K06vmware-workstation-server  K20memcached           K21postgresql
K08tomcat7                    K20nagios              K50cassandra
K08vmware                     K20nagios-nrpe-server  README
K09apache2                    K20nginx               S20sendsigs
K10elasticsearch              K20puppetmaster        S30urandom
K10kibana                     K20puppetqd            S31umountnfs.sh
K10unattended-upgrades        K20rabbitmq-server     S40umountfs
K20apache-htcacheclean        K20redis_6379          S60umountroot
K20fcgiwrap                   K20redis-server        S90reboot
Here the first character 'S' means (S)tart files, 'K' meands (K)ill files. In other words, they indicate Enabling (S) or disabling(k) run level services.
Each of the script will be executed in alphabetical order.
Note that at runlevel 6, most of the scripts start with 'K' while runlevel 2 executes couple of Kill scripts and lots of Starts.
Let's look at some of the programs that are actually executed during a run level change:
S20rsync -> ../init.d/rsync
Note that all of the scripts that run during system start-up actually reside in the /etc/init.d/ directory.
Current level can be listed by typing the command 'who -r':
$ who -r
         run-level 5  2019-11-01 05:53
init is the first process that starts in a Linux system after the machine boots and the kernel loads into memory.
It decides how a user process or a system service should load, in what order, and whether it should start automatically.
Every process in Linux has a process ID (PID) and init has a PID of 1. It's the parent of all other processes that subsequently spawn as the system comes online.
inittab file describes how the INIT process should set up the system in a certain run-level.
As an example, the default run state is 3 as shown below:
id:3:initdefault:
The /etc/rc.d/rc script will then use the specified run level to determine which set of run scripts to execute. Under normal conditions, then, rc will run with "3" as its argument and will run all the scripts in the /etc/rc3.d directory. It will run the kill scripts (those that start with an uppercase "K") first and then the start scripts (those that start with an uppercase "S") using lines like this:
for i in /etc/rc$runlevel.d/K* ; do
Our running Linux system has a number of background processes executing at any time. These processes (services or daemons) may be native to the operating system (such as sshd), or run as part of an application (such as httpd/apache2).
We want our Linux services to run continuously without failing and start automatically if the system reboots or crashes.
A reboot can happen for many reasons: it can be a planned restart, the last step of a patch update, or the result of unexpected system behavior. A crash is what happens when the process stopping unexpectedly or becomes unresponsive to user or application requests.
Most of our standard applications that we can install, such as Nginx or MySQL, will start after reboot by default, but NOT start after a crash by default. They will come with their own init scripts in /etc/init.d already.
To make sure our service is set to automatically start, we need to make sure the service has a functional Bash init script located at /etc/init.d/service.
To enable the service, we may want to use the update-rc.d command (or for a CentOS system, chkconfig):
$ sudo update-rc.d service enable
On ubuntu, the chkconfig is no longer available for 12.10+ while for Redhat it is still available.
So, /usr/sbin/sysv-rc-conf is an alternate option for Ubuntu.
We use the 'chkconfig (or sysv-rc-conf)' command to find out runlevel of applications which are running:
$ sudo sysv-rc-conf --list
acpid
anacron
apache2      0:off	1:off	2:off	3:off	4:off	5:off	6:off
apparmor     S:on
apport
avahi-daemon
binfmt-suppo
bluetooth
brltty       S:on
chef-client  0:off	1:off	2:on	3:on	4:on	5:on	6:off
We can see, the runlevel of apache2 is 2-5. To check only the runlevel of apache2, we can use:
$ sysv-rc-conf --list apache2
apache2      0:off	1:off	2:off	3:off	4:off	5:off	6:off
To configure apache2 to start on boot:
$ sudo sysv-rc-conf apache2 on

$ sysv-rc-conf --list apache2
apache2      0:off	1:off	2:on	3:on	4:on	5:on	6:off
The equivalent chkconfig command:
$ sudo chkconfig apache2 enable

$ chkconfig --list apache2
If the command is not available, we can install it:
$ sudo apt-get install sysv-rc-conf
To find the services with runlevel with 1:on:
$ sysv-rc-conf --list |grep "1:on"
dns-clean    1:on	2:on	3:on	4:on	5:on
killprocs    1:on
pppd-dns     1:on	2:on	3:on	4:on	5:on
single       1:on
We can set runlevel via UI by just issuing a command, sysv-rc-conf:
We want to switch current timezone (UTC) to Pacific Time. We can do it like this:
$ date
Fri Sep 18 03:03:28 UTC 2015

$ sudo rm /etc/localtime
$ sudo ln -s /usr/share/zoneinfo/US/Pacific /etc/localtime
$ date
Thu Sep 17 20:04:35 PDT 2015
ln -sf will overwrite the existing one:
$ sudo ln -sf /usr/share/zoneinfo/US/Pacific /etc/localtime
Another way of setting timezones:
$ sudo timedatectl set-timezone UTC
Or the 3rd way (interactive mode):
$ sudo dpkg-reconfigure tzdata
To list all the timezones:
$ timedatectl list-timezones
Firewall decides fate of packets incoming and outgoing in system. IPTables is a rule based firewall and it is pre-installed on most of Linux operating system. By default, it runs without any rules. So, it allows all traffic by default. IPTables is a front-end tool to talk to the kernel and decides the packets to filter.
To list tables, we can use iptables -L:
$ sudo iptables -L -n -v
Chain INPUT (policy ACCEPT 2532K packets, 360M bytes)
 pkts bytes target     prot opt in     out     source               destination
    0     0 ACCEPT     tcp  --  lxcbr0 *       0.0.0.0/0            0.0.0.0/0            tcp dpt:53
    0     0 ACCEPT     udp  --  lxcbr0 *       0.0.0.0/0            0.0.0.0/0            udp dpt:53
    0     0 ACCEPT     tcp  --  lxcbr0 *       0.0.0.0/0            0.0.0.0/0            tcp dpt:67
    0     0 ACCEPT     udp  --  lxcbr0 *       0.0.0.0/0            0.0.0.0/0            udp dpt:67

Chain FORWARD (policy ACCEPT 0 packets, 0 bytes)
 pkts bytes target     prot opt in     out     source               destination
    0     0 DOCKER     all  --  *      docker0  0.0.0.0/0            0.0.0.0/0
    0     0 ACCEPT     all  --  *      docker0  0.0.0.0/0            0.0.0.0/0            ctstate RELATED,ESTABLISHED
    0     0 ACCEPT     all  --  docker0 !docker0  0.0.0.0/0            0.0.0.0/0
...

Chain OUTPUT (policy ACCEPT 2429K packets, 227M bytes)
 pkts bytes target     prot opt in     out     source               destination

Chain DOCKER (1 references)
 pkts bytes target     prot opt in     out     source               destination
Note that we used the following options "-L" (List ruleset), "-v" (Verbose) and "-n" (Displays in numeric format).
We have three chains:
- INPUT : Default chain originating to system.
- OUTPUT : Default chain generating from system.
- FORWARD : Default chain packets are send through another interface.
Another example: for a NodeJS application, we may want to redirect port 80 to 3000:
$ sudo iptables -t nat -A PREROUTING -i eth0 -p tcp --dport 80 -j REDIRECT --to-port 3000
Note we used -t before the nat table.
We may want to see the fire wall:
$ sudo iptables -nvL
Chain INPUT (policy ACCEPT 391 packets, 30731 bytes)
 pkts bytes target     prot opt in     out     source               destination

Chain FORWARD (policy ACCEPT 0 packets, 0 bytes)
 pkts bytes target     prot opt in     out     source               destination

Chain OUTPUT (policy ACCEPT 291 packets, 51291 bytes)
 pkts bytes target     prot opt in     out     source               destination
We don't see any firewall settings. That's because the command iptables -nvL is displaying the contents of the filter table. The rule we added was in the nat table. So, we need to add -t nat to look at the nat table:
$ sudo iptables -t nat -nvL
Chain PREROUTING (policy ACCEPT 649 packets, 38562 bytes)
 pkts bytes target     prot opt in     out     source               destination
   30  1760 REDIRECT   tcp  --  eth0   *       0.0.0.0/0            0.0.0.0/0            tcp dpt:80 redir ports 3000
    6   360 REDIRECT   tcp  --  eth0   *       0.0.0.0/0            0.0.0.0/0            tcp dpt:3000 redir ports 3000

Chain INPUT (policy ACCEPT 676 packets, 40162 bytes)
 pkts bytes target     prot opt in     out     source               destination

Chain OUTPUT (policy ACCEPT 169 packets, 12849 bytes)
 pkts bytes target     prot opt in     out     source               destination

Chain POSTROUTING (policy ACCEPT 169 packets, 12849 bytes)
 pkts bytes target     prot opt in     out     source               destination
In the table, I put unnecessary 2nd row which redirects port 3000 to port 3000. How we can delete it?
Let's add the line number in the output:
$ sudo iptables -t nat -L PREROUTING --line-numbers
Chain PREROUTING (policy ACCEPT)
num  target     prot opt source               destination
1    REDIRECT   tcp  --  anywhere             anywhere             tcp dpt:http redir ports 3000
2    REDIRECT   tcp  --  anywhere             anywhere             tcp dpt:3000 redir ports 3000
We use D to delete the 2nd:
$ sudo iptables -t nat -D PREROUTING 2
$ sudo iptables -t nat -L PREROUTING --line-numbers
Chain PREROUTING (policy ACCEPT)
num  target     prot opt source               destination
1    REDIRECT   tcp  --  anywhere             anywhere             tcp dpt:http redir ports 3000
If we need to see how much memory our system is using at the current moment issue the following command:
$ free -m
This command will generate output that looks like the following:
             total       used       free     shared    buffers     cached
Mem:          3545       3346        199         57         20        358
-/+ buffers/cache:       2967        578
Swap:         3681       1338       2343
where
total = used + free + buff/cache
Out of a total 3545 megabytes of memory (RAM), the system is using 3346 megabytes, and has 199 megabytes free. However, the system also has 2967 megabytes of "stale" data buffered and stored in cache. The operating system will "drop" the caches when and if it needs the space, but retains the cache if there is no other need for the space. It is totally normal for a Linux system to leave old data in RAM until the space is needed, and we should not be alarmed if only a small amount of memory is actually "free."
The vmstat tool provides information about memory, swap utilization, IO wait, and system activity.
It is a built-in Linux system monitoring tool and its primary job is measuring a system's usage of virtual memory.
It is particularly useful for diagnosing I/O-related issues.
A Linux system can run out of RAM for several reasons, such as demands from its running applications. When this happens, the Linux kernel swaps or pages out programs to the computer's storage devices, called swap space. which is a reserved area of hard drive or solid-state drive storage. It’s used as virtual memory when RAM is unavoidable. As RAM is freed up, the swapped-out data or code is swapped back into the main RAM-based memory.
When swapping happens, system performance drops drastically because the server's swap I/O speed is much slower than RAM even if SSD is used for virtual memory. In addition, when Linux uses virtual memory it spends more of its CPU cycles on managing virtual memory swapping.
Since virtual memory has a big impact on system performance, vmstat is essential for monitoring it.
In addition to monitoring virtual memory paging, vmstat also measures processes, I/O, CPU, and disk scheduling.
vmstat [options] [delay] [count]
- options: vmstat command settings.
- delay: the time interval between updates. If no delay is specified, the report runs as an average since the last reboot.
- count: the number of updates printed after the given delay interval. If no count is set, the default is an infinite number of updates every x seconds (where x = delay).
So, the following command runs a vmstat every second(1), twenty times(20).
This gives a pretty good sample of the current state of the system.
The output generated should look like the following:
$ vmstat 1 20
procs -----------memory---------- ---swap-- -----io---- -system-- ------cpu-----
 r  b   swpd   free   buff  cache   si   so    bi    bo   in   cs us sy id wa st
 2  0      0 1664608 181656 395496    0    0     1     1   67   61  0  0 99  0  0
 0  0      0 1664608 181656 395496    0    0     0     0  197  420  1  1 99  0  0
 0  0      0 1664608 181656 395496    0    0     0     0  203  406  0  1 99  0  0
 0  0      0 1664608 181656 395496    0    0     0     0  173  291  0  0 99  0  0
 1  0      0 1664608 181656 395496    0    0     0     0  263  504  0  1 99  0  0
...
The memory and swap columns provide the same kind of information provided by the free -m command:
$ free -m
              total        used        free      shared  buff/cache   available
Mem:           2492         303        1625           0         563        2061
Swap:          1023           0        1023

$ free -h
              total        used        free      shared  buff/cache   available
Mem:           2.4G        302M        1.6G        844K        563M        2.0G
Swap:          1.0G          0B        1.0G
The most salient information produced by this command is the wa column, which is the final column in most implementations. This field displays the amount of time the CPU spends waiting for IO operations to complete.
If this number is consistently and considerably higher than 0, we might consider taking measures to address the IO usage.
Here are details of the vmstat output:
- procs:
The procs data reports the number of processing jobs waiting to run and allows us to determine if there are processes "blocking" our system from running smoothly. The r column displays the total number of processes waiting for access to the processor.
The b column displays the total number of processes in a "sleep" state.
These values are often 0. - memory:
The information displayed in the memory section provides the same data about memory usage as the commandfree -m.
The swapd or “swapped” column reports how much memory has been swapped out to a swap file or disk.
The free column reports the amount of unallocated memory.
The buff or "buffers" column reports the amount of allocated memory in use. The cache column reports the amount of allocated memory that could be swapped to disk or unallocated if the resources are needed for another task. - swap:
The swap section reports the rate that memory is sent to or retrieved from the swap system.
By reporting “swapping” separately from total disk activity, vmstat allows us to determine how much disk activity is related to the swap system.
 The si column reports the amount of memory that is moved from swap to "real" memory per second.
The so column reports the amount of memory that is moved to swap from "real" memory per second.
- i/o:
The io section reports the amount of input and output activity per second in terms of blocks read and blocks written.
The bi column reports the number of blocks received, or "blocks in", from a disk per second.
The bo column reports the number of blocks sent, or "blocks out", to a disk per second.
- system:
The system section reports data that reflects the number of system operations per second.
The in column reports the number of system interrupts per second, including interrupts from system clock.
The cs column reports the number of context switches that the system makes in order to process all tasks.
- cpu:
The cpu section reports on the use of the system's CPU resources.
The columns in this section always add to 100 and reflect "percentage of available time".
The us column reports the amount of time that the processor spends on user space tasks, or all non-kernel processes.
The sy column reports the amount of time that the processor spends on kernel related tasks.
The id column reports the amount of time that the processor spends idle.
The wa column reports the amount of time that the processor spends waiting for IO operations to complete before being able to continue processing tasks.
The st column reports the amount of time taht a virtual CPU waits for a real CPU while the hypervisor is servicing another virtual processor. Basically, the steal time (stolen cpu) cycle counts the amount of time that our virtual machine is ready to run but could not run due to other virtual machines competing for the CPU.
st should approach zero. Anything above zero means there is some performance degradation. For example, assume we have a machine with 16 physical CPU cores running 10 VMs, and each one has been allocated two virtual CPUs. This means 20 virtual CPUs are competing for 16 physical CPUs -- creating a prime environment for stolen CPU.
Here are the states of a process:
| State | Description |
|---|---|
| D | uninterruptible sleep (usually IO) |
| R | running or runnable (on run queue) |
| S | interruptible sleep (waiting for an event to complete) |
| T | stopped, either by a job control signal or because it is being traced |
| Z | defunct ("zombie") process, terminated but not reaped by its parent |
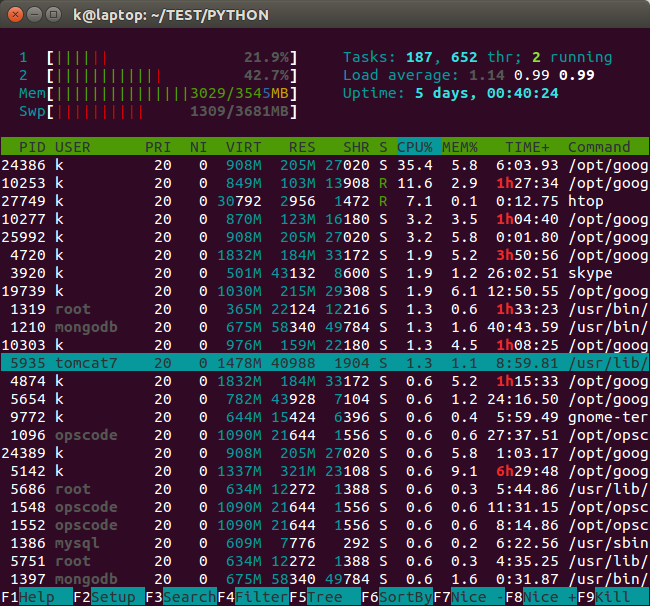
If we want a more organized and real-time view of the current state of our system, we may want to use a tool called htop. Note that this is not installed by default on most systems.
* * * * *
In order, the asterisks represent:
1. Minute, 2. Hour 3. Day of month, 4. Month, 5. Day of week
The swappiness parameter controls the tendency of the kernel to move processes out of physical memory and onto the swap disk. Because disks are much slower than RAM, this can lead to slower response times for system and applications if processes are too aggressively moved out of memory.
swappiness can have a value of between 0 and 100:
- swappiness=0 : Version 3.5 and over: disables swapiness. Prior to 3.5: tells the kernel to avoid swapping processes out of physical memory for as long as possible.
- swappiness=1 : Version 3.5 and over: Minimum swappiness without disabling it entirely.
- swappiness=100 tells the kernel to aggressively swap processes out of physical memory and move them to swap cache.
Ref: How do I configure swappiness?
We can check its value:
$ cat /proc/sys/vm/swappiness
60
We can set it:
$ sudo sysctl vm.swappiness=10
vm.swappiness = 10

$ cat /proc/sys/vm/swappiness
10
To monitor disk read/write rates of individual disks, we can use iostat. This tool allows us to monitor I/O statistics for each device or partition. Using iostat command, we can find out disk utilization and monitor system input/output device loading by observing the time the physical disks are active in relation to their average transfer rates.
To use this tool, we need to run sysstat package.
To install sysstat on Ubuntu or Debian:
$ sudo apt-get install sysstat
Syntax for disk utilization report looks like this:
iostat -d -x interval count
where:
- -d : Display the device utilization report (d == disk)
- -x : Display extended statistics including disk utilization
- interval : It is time period in seconds between two samples. iostat 2 will give data at each 2 seconds interval.
- count : It is the number of times the data is needed. iostat 2 5 will give data at 2 seconds interval 5 times.
$ iostat -d -x 5 3
Linux 3.13.0-40-generic (laptop) 	10/14/2015 	_x86_64_	(2 CPU)

Device:         rrqm/s   wrqm/s     r/s     w/s    rkB/s    wkB/s avgrq-sz avgqu-sz   await r_await w_await  svctm  %util
sda               1.75     4.78    6.15    2.13   104.99    45.86    36.45     0.27   32.58   22.74   61.06   3.03   2.51

Device:         rrqm/s   wrqm/s     r/s     w/s    rkB/s    wkB/s avgrq-sz avgqu-sz   await r_await w_await  svctm  %util
sda               0.00     5.20    0.00    7.80     0.00    80.00    20.51     0.14   17.74    0.00   17.74  12.41   9.68

Device:         rrqm/s   wrqm/s     r/s     w/s    rkB/s    wkB/s avgrq-sz avgqu-sz   await r_await w_await  svctm  %util
sda               4.20     4.40    0.80    2.80    20.00    47.20    37.33     0.11   31.11   76.00   18.29  31.11  11.20
The following values from the iostat output are the major ones:
- r/s : The number of read requests per second. See if a hard disk reports consistently high reads
- w/s : The number of write requests per second. See if a hard disk reports consistently high writes
- svctm : The average service time (in milliseconds) for I/O requests that were issued to the device.
- %util : Percentage of CPU time during which I/O requests were issued to the device (bandwidth utilization for the device). Device saturation occurs when this value is close to 100%.
We need to install iotop:
$ sudo apt-get install iotop
Running iotop without any argument displays a list of all existing processes regardless of their disk I/O activities. If we want iotop to only show processes that are actually doing disk I/O, run the following instead:
$ sudo iotop -o

Security-Enhanced Linux (SELinux) is a mandatory access control (MAC) security mechanism implemented in the kernel. SELinux was first introduced in CentOS 4 (SELinux).
SELinux is a Mandatory Access Control (MAC) system which is a kernel enhancement to confine programs to a limited set of resources (SELinux).
Traditional access control methods such as file permissions or access control lists (ACLs) are used to control the file access of users. Users and programs alike are allowed to grant insecure file permissions to others or, conversely, to gain access to parts of the system that should not otherwise be necessary for normal operation. For example, keys in ~/.ssh/.
The restricted deletion flag or sticky bit is a permission bit that is set on a file or a directory that allows only the file's owner, directory's owner or the root user to delete or rename the file.
Without the sticky bit set, any user with write and execute permissions for the directory can rename or delete contained files, regardless of the file's owner. Typically this is set on the /tmp directory to prevent ordinary users from deleting or moving other users' files.
What is the "t" letter in the output of "ls -ld /tmp"?.
$ ls -ld /tmp
drwxrwxrwt 15 root root 24576 Oct 16 17:12 /tmp
We can remove it:
$ sudo chmod -t /tmp

$ ls -ld /tmp
drwxrwxrwx 15 root root 24576 Oct 16 17:12 /tmp
Add back in:
$ sudo chmod +t /tmp

$ ls -ld /tmp
drwxrwxrwt 15 root root 24576 Oct 16 17:12 /tmp
In the previous section, we discussed the sticky bit
but there are other special permissions apart from the normal file permissions rwx which we set with chmod and chown commands.
Set-user Identification (SUID) and Set-group identification (SGID) are for granular file/folder management by Linux administrator.
Let's take a look at the /usr/bin/passwd command. This command, by default, has the SUID permission set:
$ ls -l /usr/bin/passwd
-rwsr-xr-x 1 root root 59640 Mar 22  2019 /usr/bin/passwd
On Linux system, stored passwords are protected: only someone with root privileges can access the file that contains the passwords. That might sound ok, however, how do those who don’t have that access change their passwords?
Typically, Linux commands and programs run with the same set of permissions as the person who launches the program.
When root runs the passwd command to change a password, it runs with root's permissions. That means the passwd command can freely access the stored passwords in the /etc/shadow file.
What would be ideal is a scheme in which anyone on the system could launch the passwd program, but have the passwd program retain root's elevated privileges.
This would enable a user to change his/her own password.
So, the SUID makes programs and commands to run with the permissions of the file owner, rather than the permissions of the person who launches the program.
We usualy run the passwd command as a normal user without 'sudo'. That's fine because we have 'x' permissions for both 'group' and 'others':
So if the file is owned by root and the SUID bit is turned on, the program will run as root. Even if we execute it as a regular user.
So, while executing the passwd as a normal user, we are allowed to modify our password thanks to the fact that SUID bit 's' is turned on.
SGID is the same as SUID, but inherits group privileges of the file on execution, not user privileges. Similar way when we create a file within directory,it will inherit the group ownership of the directories.
Using a numerical method, we need to pass a fourth, preceding digit in our chmod command:
SUID = 4
SGID = 2
Sticky = 1
Here are examples:
no suid/sgid:
$ ls -l a.sh
-rwxr-xr-x 1 k k 0 Mar 26 14:10 a.sh
suid & user's executable bit enabled (lowercase s) (chmod 4755):
$ chmod u+s a.sh
$ ls -l a.sh
-rwsr-xr-x 1 k k 13 Mar 26 14:10 a.sh
suid enabled & executable bit disabled (uppercase S):
$ chmod u-x a.sh
$ ls -l a.sh
-rwSr-xr-x 1 k k 13 Mar 26 14:10 a.sh
sgid & group's executable bit enabled (lowercase s) (chmod 2755):
$ chmod g+s a.sh
$ ls -l a.sh
-rwxr-sr-x 1 k k 13 Mar 26 14:10 a.sh
sgid enabled & executable bit disabled (uppercase S):
$ chmod g-x a.sh
$ ls -l a.sh
-rwxr-Sr-x 1 k k 13 Mar 26 14:10 a.sh
The followings are a few of the Linux commands that use the SUID bit to give the command elevated privileges when run by a regular user:
$ ls -l /bin/su
-rwsr-xr-x 1 root root 44664 Mar 22  2019 su

$ ls -l /bin/mount
-rwsr-xr-x 1 root root 43088 Sep 16 18:43 mount

$ ls -l /bin/umount
-rwsr-xr-x 1 root root 26696 Sep 16 18:43 umount

$ ls -l /bin/ping
-rwsr-xr-x 1 root root 44168 May  7  2014 ping

$ ls -l /usr/bin/passwd
-rwsr-r-x 1 root root 59640 Mar 22  2019 passwd
The most frequent use of lsof command is when a disk cannot be unmounted as it says the files are being used. Using this command we can identify the files which are in use / opened by which process.
In Linux, everything is a files (pipes, sockets, directories, and devices).
$ lsof -i
COMMAND     PID USER   FD   TYPE  DEVICE SIZE/OFF NODE NAME
chrome     4580    k   84u  IPv4 2743073      0t0  TCP laptop:34284->ne1onepush.vip.ne1.yahoo.com:https (ESTABLISHED)

$ lsof -i -n
COMMAND     PID USER   FD   TYPE  DEVICE SIZE/OFF NODE NAME
chrome     4580    k   84u  IPv4 2753410      0t0  TCP 192.168.1.1:34889->98.138.79.73:https (ESTABLISHED)
where:
- -i Lists IP sockets.
- -n Do not resolve hostnames (no DNS).
To find out all the running process of specific port, just use the following command with option -i:
$ lsof -i :8087
COMMAND  PID   USER   FD   TYPE DEVICE SIZE/OFF NODE NAME
node    2208 ubuntu   10u  IPv4  11235      0t0  TCP ip-172-31-10-18.us-west-1.compute.internal:8087 (LISTEN)
For more details, visit lsof
This section is a compiled work from the following sources:
The top program provides a dynamic real-time view of a running system. It can display system summary information, as well as a list of processes or threads currently being managed by the kernel.
Descriptions for the top display:
%Cpu(s): 10.7 us, 2.9 sy, 0.0 ni, 85.7 id, 0.5 wa, 0.0 hi, 0.2 si, 0.0 st
This line shows CPU state percentages based on the interval since the last refresh.
- us, user user cpu time (or) % CPU time spent in user space, time running un-niced user processes.
Shells, compilers, databases, web servers, and the programs associated with the desktop are all user space processes. If the processor isn't idle, it is quite normal that the majority of the CPU time should be spent running user space processes. - sy, system system cpu time (or) % CPU time spent in kernel space. This is the amount of time that the CPU spent running the kernel. All the processes and system resources are handled by the Linux kernel. When a user space process needs something from the system, for example when it needs to allocate memory, perform some I/O, or it needs to create a child process, then the kernel is running. In fact the scheduler itself which determines which process runs next is part of the kernel. The amount of time spent in the kernel should be as low as possible. In this case, just 2.9% of the time given to the different processes was spent in the kernel. This number can peak much higher, especially when there is a lot of I/O happening.
- ni, nice time running niced user processes.
Niceness is a way to tweak the priority level of a process so that it runs less frequently. A niceness of -20 is the highest priority and 19 is the lowest priority. So, -20 is the most favorable scheduling and 19 is the least favorable scheduling. A higher-priority process will get a larger chunk of the CPU time than a lower-priority process. By default processes on Linux are started with a niceness of 0.
A "niced" process is one with a positive nice value. So if the processor's nice value is high, that means it is working with some low priority processes. So this indicator is useful when we see high CPU utilization and we are afraid that this high load will have bad effect on our system:- High CPU utilization with high nice value: Nothing to worry, not so important tasks doing there job, important processes will easily get CPU time if they need. This situation is not a real bottleneck.
- High CPU utilization with low nice value: Something to worry because the CPU is stressed with important processes so these or new processes will have to wait. This situation is a real bottleneck.
- id, idle time spent in the kernel idle handler.
The id statistic tell us that the processor was idle just over 85.7% of the time during the last sampling period. The total of the user space percentage - us, the niced percentage - ni, and the idle percentage - id, should be close to 100%. Which it is in this case. If the CPU is spending a more time in the other states then something is probably wrong, and may need trouble shooting. - wa, IO-wait time waiting for I/O completion.
I/O operations are slow compared to the speed of a CPU. There are times when the processor has initiated a read or write operation and then it has to wait for the result, but has nothing else to do. In other words it is idle while waiting for an I/O operation to complete. The time the CPU spends in this state is shown by the 'wa' statistic.
'wa' is the measure of time over a given period that a CPU spent idle because all runnable tasks were waiting for a IO operation to be fulfilled. - hi time spent servicing hardware interrupts.
This is the time spent processing hardware interrupts. Hardware interrupts are generated by hardware devices (network cards, keyboard controller, external timer, hardware senors, etc.) when they need to signal something to the CPU (data has arrived for example). Since these can happen very frequently, and since they essentially block the current CPU while they are running, kernel hardware interrupt handlers are written to be as fast and simple as possible.
On a system where no processes have been niced then the number will be 0.
Hardware interrupts are physical interrupts sent to the CPU from various peripherals like disks and network interfaces. Software interrupts come from processes running on the system. A hardware interrupt will actually cause the CPU to stop what it is doing and go handle the interrupt. A software interrupt doesn't occur at the CPU level, but rather at the kernel level. - si time spent servicing software interrupts.
This represents the time spent in softirqs. - st time stolen from this vm by the hypervisor.
This represents "steal time", and it is only relevant in virtualized environments. It represents time when the real CPU was not available to the current virtual machine - it was "stolen" from that VM by the hypervisor (either to run another VM, or for its own needs).
This number tells how long the virtual CPU has spent waiting for the hypervisor to service another virtual CPU running on a different virtual machine. Since in the real-world these virtual processors are sharing the same physical processor(s) then there will be times when the virtual machine wanted to run but the hypervisor scheduled another virtual machine instead.
Here are some of the trouble shootings:
- High user mode CPU usage - If a system suddenly jumps from having spare CPU cycles to running flat out high, then the first thing to check is the amount of time the CPU spends running user space processes. If this is high, then it probably means that a process has gone crazy and is eating up all the CPU time.
Using the top command we will be able to see which process is to blame and restart the service or kill the process. - High kernel CPU usage - Sometimes this is acceptable. For example, a program that does lots of console I/O can cause the kernel usage to spike. However if it remains higher for long periods of time, then it could be an indication that something isn't right.
A possible cause of such spikes could be a problem with a driver/kernel module. - High niced value CPU usage - If the amount of time the CPU is spending running processes with a niced priority value jumps, then it means that someone has started some intensive CPU jobs on the system,
but they have niced the task:
- If the niceness level is greater than zero, then the user has been courteous enough lower to the priority of the process and therefore avoid a CPU overload. There is probably little that needs to be done in this case, other than maybe find out who has started the process.
- But if the niceness level is less than 0, then we will need to investigate what is happening and who is responsible, as such a task could easily cripple the responsiveness of the system.
- High waiting on I/O This means that there are some intensive I/O tasks running on the system that don't use up much CPU time. If this number is high for anything other than short bursts, then it means that either the I/O performed by the task is very inefficient, or the data is being transferred to a very slow device, or there is a potential problem with a hard disk that is taking a long time to process reads & writes.
- High interrupt processing This could be an indication of a broken peripheral that is causing lots of hardware interrupts or of a process that is issuing lots of software interrupts.
- Large stolen time Basically, this means that the host system running the hypervisor is too busy. If possible, check the other virtual machines running on the hypervisor, and/or migrate to our virtual machine to another host.
dmidecode command reads the system DMI table to display hardware and BIOS information of a linux box:
$ sudo dmidecode
Getting SMBIOS data from sysfs.
SMBIOS 2.7 present.
11 structures occupying 359 bytes.
Table at 0x000EB01F.

Handle 0x0000, DMI type 0, 24 bytes
BIOS Information
...
System Information
...
Chassis Information
...
Processor Information
...
Physical Memory Array
...
System Boot Information
	Status: No errors detected

Handle 0x7F00, DMI type 127, 4 bytes
End Of Table
where the SMBIOS stands for System Management BIOS.
w displays information about the users currently on the machine, and their processes.
The header shows, in this order, the current time, how long the system has been running, how many users are currently logged on,
and the system load averages for the past 1, 5, and 15 minutes:
$ w
 16:38:10 up 487 days, 10:45,  1 user,  load average: 0.00, 0.00, 0.00
USER     TTY      FROM             LOGIN@   IDLE   JCPU   PCPU WHAT
ubuntu   pts/0    73.70.219.237    16:29    0.00s  0.04s  0.00s w
The output shows the following entries for each user: login name, the tty name, the remote host, login time, idle time, JCPU, PCPU, and the command line of their current process.
- 16:38:10 - The current system time.
- up 487 days - The length of time the system has been up.
- 1 user - The number of logged-in users.
- load average: 0.00, 0.00, 0.00 - The system load averages for the past 1, 5, and 15 minutes.
The first line provides the same information as the uptime command. It contains the following:
- USER – The name of the logged user.
- TTY – The name of the terminal used by the user.
- FROM – The host name or IP address from where the user is logged in.
- LOGIN@ – The time when the user logged in.
- IDLE – The time since the user last interacted with the terminal. Idle time.
- JCPU – The time used by all processes attached to the tty.
- PCPU – The time used by the user’s current process. The one displayed in the WHAT field.
- WHAT – The user’s current process and options/arguments.
The second line includes the following:
DevOps
DevOps / Sys Admin Q & A
Linux - system, cmds & shell
- Linux Tips - links, vmstats, rsync
- Linux Tips 2 - ctrl a, curl r, tail -f, umask
- Linux - bash I
- Linux - bash II
- Linux - Uncompressing 7z file
- Linux - sed I (substitution: sed 's///', sed -i)
- Linux - sed II (file spacing, numbering, text conversion and substitution)
- Linux - sed III (selective printing of certain lines, selective definition of certain lines)
- Linux - 7 File types : Regular, Directory, Block file, Character device file, Pipe file, Symbolic link file, and Socket file
- Linux shell programming - introduction
- Linux shell programming - variables and functions (readonly, unset, and functions)
- Linux shell programming - special shell variables
- Linux shell programming : arrays - three different ways of declaring arrays & looping with $*/$@
- Linux shell programming : operations on array
- Linux shell programming : variables & commands substitution
- Linux shell programming : metacharacters & quotes
- Linux shell programming : input/output redirection & here document
- Linux shell programming : loop control - for, while, break, and break n
- Linux shell programming : string
- Linux shell programming : for-loop
- Linux shell programming : if/elif/else/fi
- Linux shell programming : Test
- Managing User Account - useradd, usermod, and userdel
- Linux Secure Shell (SSH) I : key generation, private key and public key
- Linux Secure Shell (SSH) II : ssh-agent & scp
- Linux Secure Shell (SSH) III : SSH Tunnel as Proxy - Dynamic Port Forwarding (SOCKS Proxy)
- Linux Secure Shell (SSH) IV : Local port forwarding (outgoing ssh tunnel)
- Linux Secure Shell (SSH) V : Reverse SSH Tunnel (remote port forwarding / incoming ssh tunnel) /)
- Linux Processes and Signals
- Linux Drivers 1
- tcpdump
- Linux Debugging using gdb
- Embedded Systems Programming I - Introduction
- Embedded Systems Programming II - gcc ARM Toolchain and Simple Code on Ubuntu/Fedora
- LXC (Linux Container) Install and Run
- Linux IPTables
- Hadoop - 1. Setting up on Ubuntu for Single-Node Cluster
- Hadoop - 2. Runing on Ubuntu for Single-Node Cluster
- ownCloud 7 install
- Ubuntu 14.04 guest on Mac OSX host using VirtualBox I
- Ubuntu 14.04 guest on Mac OSX host using VirtualBox II
- Windows 8 guest on Mac OSX host using VirtualBox I
- Ubuntu Package Management System (apt-get vs dpkg)
- RPM Packaging
- How to Make a Self-Signed SSL Certificate
- Linux Q & A
- DevOps / Sys Admin questions
Ph.D. / Golden Gate Ave, San Francisco / Seoul National Univ / Carnegie Mellon / UC Berkeley / DevOps / Deep Learning / Visualization